Refs still don't like Fulham
last updated Thursday 22nd February 2001, 7:27 PM
Unfortunately consistency is
no problem for The Super Whites in terms of the number of yellow cards referees
dish out to our players.
Referees are giving yellow cards to our quicker than any other team in the
Nationwide and the Premiership.
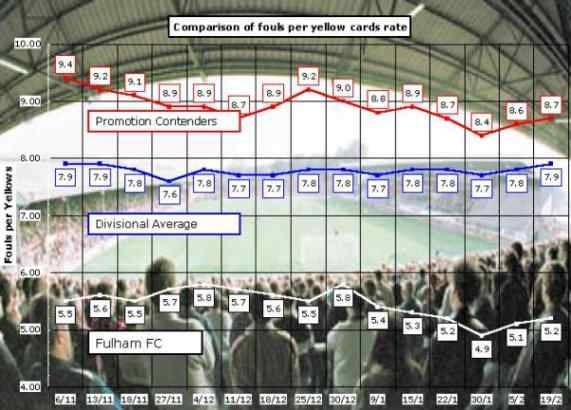
On average our lads get a yellow card for 5 fouls while our promotion rivals
get a yellow for 9 fouls. At that rate we would have 23 less yellow cards
and of course fewer suspensions.
| |
|
|
| |
 |
|
| |
The
Fouls per Yellow card graph above shows business as usual with Fulham
being cautioned faster than the average for our Promotion rivals and
other teams in Division One |
|
We are also being yellow carded quicker than the Premiership average, as
an example Man Utd have the same number of fouls as us but have been given
just 28 cards a rate of 11.
|
Fouls |
Yellows |
Reds |
Fouls per
Yellows
|
| Fulham |
301
|
58
|
0
|
5.2
|
| Promotional Rivals average |
373
|
43
|
2
|
8.7
|
| Division One average |
356
|
45
|
2
|
7.9
|
| Nationwide average |
350
|
43
|
2
|
8.1
|
| Premiership average |
380
|
41
|
2
|
9.2
|
Any hope that the anti-Fulham bias would correct itself before the end of
the season is fast disappearing with just 13 games to go. To correct the
bias now we would have to commit 50% more fouls than we do normally and
Referees would have stop Yellow carding us completely just to get us to
the Divisional average rate of 8. To get to the same rate as our rivals
we would need to increase our foul rate by 70% without any further yellow
cards.
The argument that Fulham, in some way,
deserve this treatment by Referees is undermined by Fulham being one of
only 7 teams in the Nationwide and Premiership who have not received a
red card so far this season.
|
Source
Share this article
Views
1734
Comments
Article Tags