3 users online
Williefelve, Ronaldces, Jamesestar
Fulham unfairly penalised
last updated Friday 11th May 2001, 1:15 PM
Fulham, 1st Division Champions, just miss
out on another trophy for the 2000/2001 season as they have finished second
to Crewe in the Nationwide Nationwide Fairplay League.
Positions were decided by a points system that gave each squad 1 pt for
a foul, 2pts for a yellow card and 5 pts for a red card. So Fulham were
second with an average of just under 12.4 points per match. Well done to
Crewe but shame on the Nationwide League.
As can be seen below it seems that Fulham were unfairly penalised by Referees
throughout the season. This would have led to players, strikers in the main,
being unfairly stopped during games and then unfairly receiving suspensions.
It is hard to explain why the Fulham squad should have been given 70 yellow
cards, one of the worst 20 in the league, while only one squad out of the
72, Crewe, committed less fouls!!
|
Nationwide
Fairplay League 2000/2001
|
Fouls
|
Yel
|
Red
|
Pts
|
Fpy
|
| 1st |
Crewe |
394
|
42
|
2
|
10.6
|
9.4
|
| 2nd |
Fulham |
419
|
70
|
2
|
12.4
|
6.0
|
| 3rd |
Port Vale |
443
|
59
|
2
|
12.4
|
7.5
|
| |
|
|
|
|
|
| Nationwide average |
550
|
65
|
4
|
15.2
|
8.5
|
| Division One Average |
547
|
67
|
3
|
15.2
|
8.2
|
| D1 Pormotion Rivals Average |
571
|
64
|
2
|
15.5
|
8.9
|
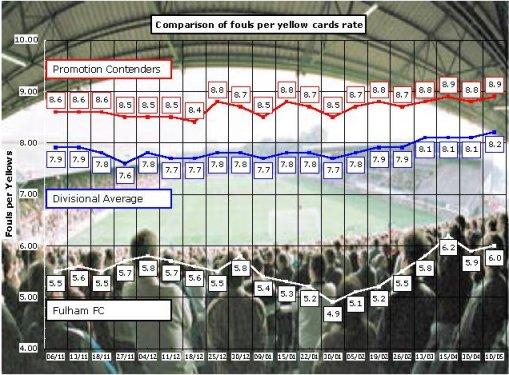
When you look at the average number of fouls different clubs committed per
yellow (Fpy) the situation is even harder to understand. Fulham were given
a yellow card for every 6 fouls the quickest rate in the whole of the Nationwide
and Premiership leagues.
If Fulham had been yellow carded at the same rate as their promotion rivals
they would have received 23 fewer yellow cards. As can be seen below this
apparent bias against Fulham continued throughout the season.
We now have to wait to see if Fulham will be facing a similar bias in the
Premiership.
|
| |
|
|
| |
 |
|
| |
Rate
of yellow cards per fouls 2000/2001 |
|
|
| |
Source
Share this article
Views
1256
Comments
Article Tags